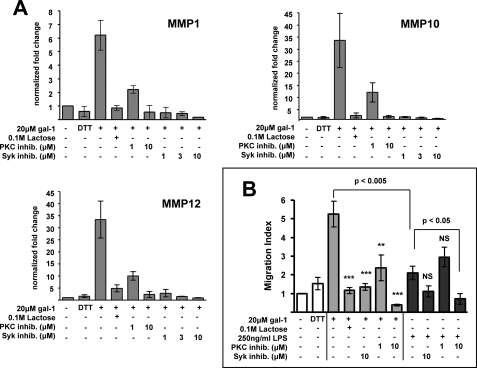
FIGURE 6.
Syk and PKC are critical for galectin-1-induced MMP gene expression and enhanced migration through the extracellular matrix. A, MMP gene expression was quantified by real time quantitative RT-PCR at 18 h following galectin-1 (20 μm) stimulation in the presence or absence of the indicated concentrations of Syk inhibitor (Calbiochem 574711), PKC inhibitor (bisindolylmaleimide I), or 0.1 m lactose. DTT refers to buffer control (80 μm DTT + 10 μg/ml polymyxin B). mRNA expression of each gene is normalized to the housekeeping gene β-actin. The data are shown as fold changes of normalized mRNA expression relative to the untreated condition. The graphs depict the means ± S.E. of three independent human donors. B, migration of MDDCs treated with 250 ng/ml LPS (black bars), 20 μm galectin-1 (gray bars), or DTT buffer control in the presence or absence of Syk inhibitor (10 μm), PKC inhibitor (1 or 10 μm) or 0.1 m lactose was measured using transwell assays with Matrigel-coated inserts (8.0-μm pore). The bottom chamber contained 200 ng/ml CCL19 (MIP-3β), which served as the chemoattractant. Each experiment consisted of at least two independent counts by different individuals, one blinded to the sample identity (see “Experimental Procedures”). The data are normalized as relative migration compared with immature DCs in which the average from all counts in each experiment is set at 1.0 (7). The data are shown as the means ± S.E. of four independent human donors. Significance was determined by two-tailed unpaired Student's t test. **, p < 0.005; ***, p < 0.0005 compared with galectin-1 stimulation alone. NS, not significant compared with LPS stimulation alone.

