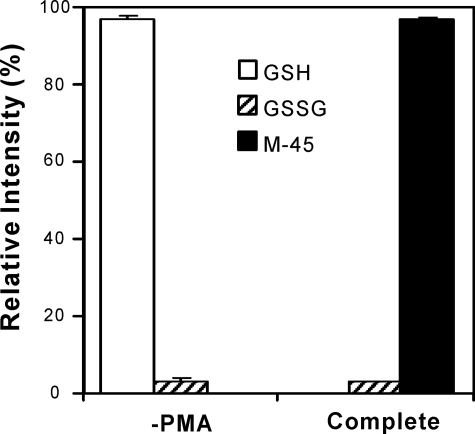
FIGURE 9.
Quantification of GSH, GSSG, and M-45 produced by activated human neutrophils. The experimental conditions were the same as described in the legend to Fig. 6. Relative intensity of GSH, GSSG, and M-45 were determined by dividing the peak area of the compound of interest by the sum of all the detected peaks. The peak area was determined by LC-MS/MS, using the selective reaction monitoring mode (GSH, m/z 308.1 → 179.0; GSSG, m/z 307.5 → 484.0; M-45, m/z 568.1 → 550.1). Results are mean ± S.D. from 3 independent experiments.

