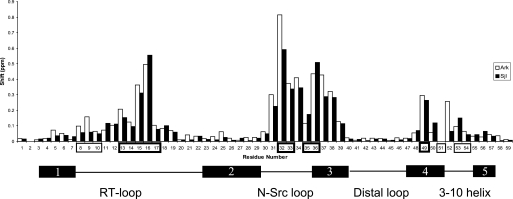
FIGURE 3.
Backbone amide chemical shift differences between the free and bound AbpSH3 complexes. The ArkA target complex is in white and Sjl2 target complex is in black. Surface I and surface II residues are boxed in thin and thick lines, respectively. A schematic of the secondary structure of the SH3 domain is shown at the bottom. Residues 2 and 51 are prolines and have no values in this plot.

