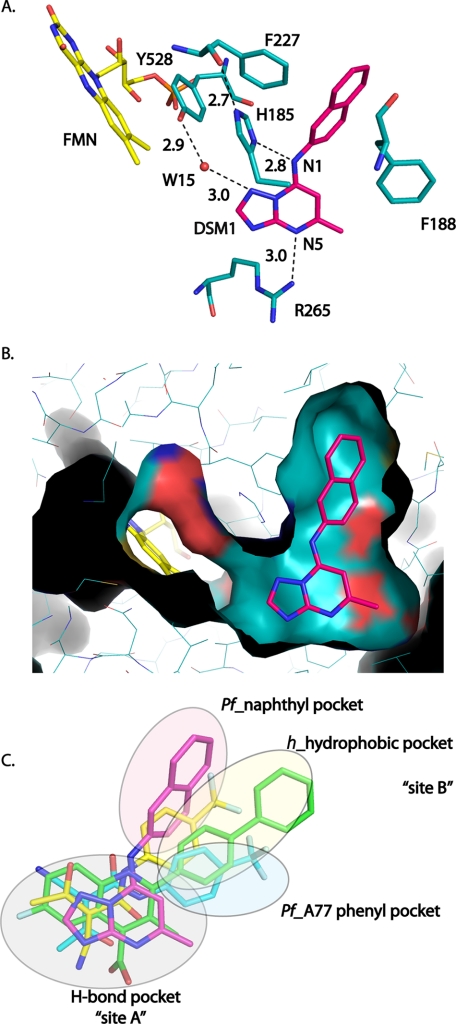
FIGURE 4.
DHODH inhibitor-binding site interactions. A, H-bonding interactions between DSM1 and PfDHODH. DSM1 is displayed in pink, and residues are displayed in teal. Distances are shown for H-bond interactions observed between the inhibitor and residues in the binding site. B, van der Waal's surface representation of DSM1 bound to PfDHODH (cyan) as calculated by PyMol. Ligands were removed from the structure prior to calculation of the surface. The figure shows a narrow channel is present extending from C-5 of DSM1 to FMN. DSM1 is displayed in pink, FMN is displayed in yellow, and amino acid residues and the surface are displayed in teal. C, structural alignment of PfDHODH and hDHODH inhibitor binding modes. The structures of PfDHODH-DSM1 (pink), PfDHODH-A77 (turquoise), hDHODH-bre (green), and hDHODH-A77 (yellow) were superimposed as described in methods. Only the bound inhibitor is displayed.

