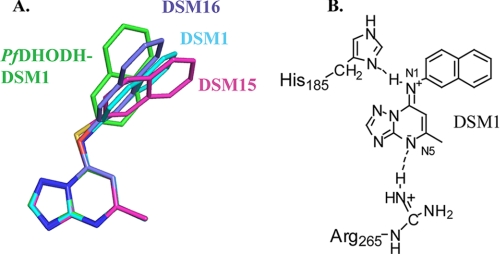
FIGURE 5.
Comparison of protein bound inhibitor conformations with free ligand structures. A, comparison of the conformation of DSM1 bound to PfDHODH (green) with the conformations of DSM1 (cyan), DSM15 (pink), and DSM16 (purple) as observed in the small molecule x-ray structures. B, schematic resonance structure of DSM1 forming H-bonding ion pair interactions with PfDHODH. H-bonds are depicted by the dashed line.

