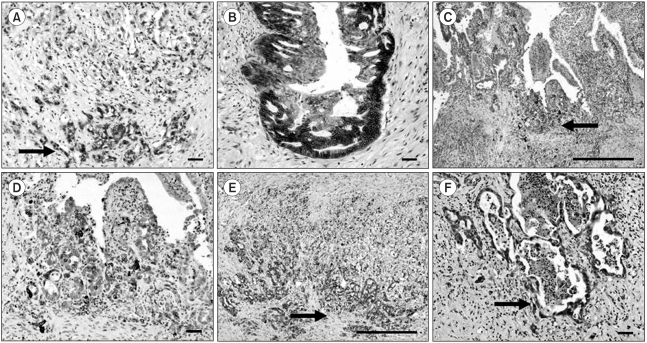
Fig. 2.
Comparison of the signal intensities in cancer cells between the central area and invasive front. A-B) β-catenin (A, ×100, scale bar 100µm) (B, ×100, scale bar 100µm), C-D) Cox-2 (C, ×40, scale bar 1 mm) (D, ×100, scale bar 100µm) and E-F) c-Met (E, ×40, scale bar 1 mm) (F, ×100, scale bar 100µm). Note the increased immunoreactivities of Cox-2, c-Met and β-catenin in cancer cells forming the invasive front (arrows) compared to those of cells in the central area.

