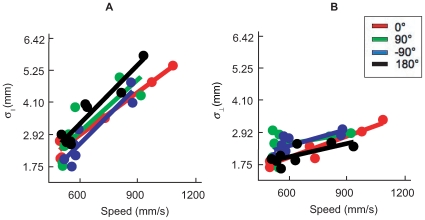
Figure 4. Speed-accuracy tradeoff (SAT).
A. Spatial variability parallel to the direction of movement  was plotted as a function of the average speed of the movement (mm/sec) from subject AI. Different colors coded for different direction conditions. Each data point represents a single condition. The lines represented the best fitted linear SAT functions (Eq. 4). B. Spatial variability perpendicular to the direction of movement
  was plotted against average speed from the same subject.

