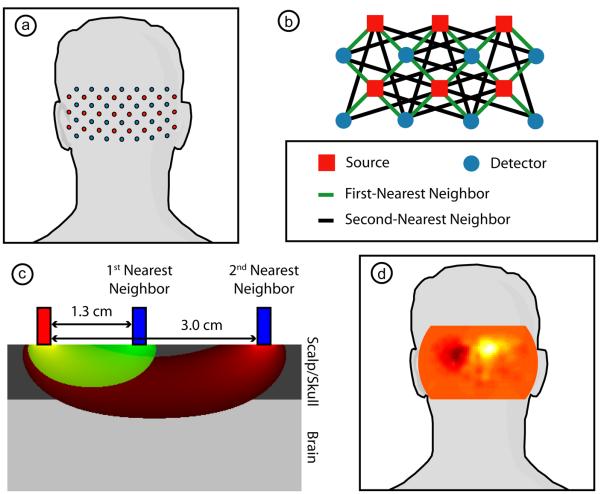
Figure 1. Our high-density diffuse optical tomography system.
(a) Schematic showing the placement of the array of 24 sources (red) and 28 detectors (blue) over the occipital cortex of an adult. (b) Schematic showing the arrangement of first-and second-nearest neighbors within a subset of this array. Due to the high dynamic range of our system, all of these measurements are used within the 3D reconstruction. (c) A cross-section through the analytic solution to the diffusion approximation for a first-nearest neighbor (sensitivity in green) and a second-nearest neighbor (sensitivity in red) within a semi-infinite, homogeneous geometry. The sensitivity functions have been truncated at a fluence of 5% of maximum. Optodes are modeled as exponentially decaying line sources and have been integrated across the 3 mm optode diameter. (Note that these sensitivity functions appear broader and with less of a peak under the source than would be obtained using the traditional point source model.) Measurement depth-of-penetration increases with increasing source-detection separation. Since first-nearest neighbor measurements contain only limited sensitivity to the cortex (shown here beginning at 8 mm depth), their average can be used as measurement of superficial and systemic hemodynamics. This nuisance regressor was then removed from all channels to improve the system's brain specificity. (d) A neuronal activation in the visual cortex due to a visual stimulus placed over a schematic of the head to show direction-of-view. All images are posterior coronal projections of a cortical shell, as if looking at the surface of the brain from behind the subject with the scalp and skull removed.

