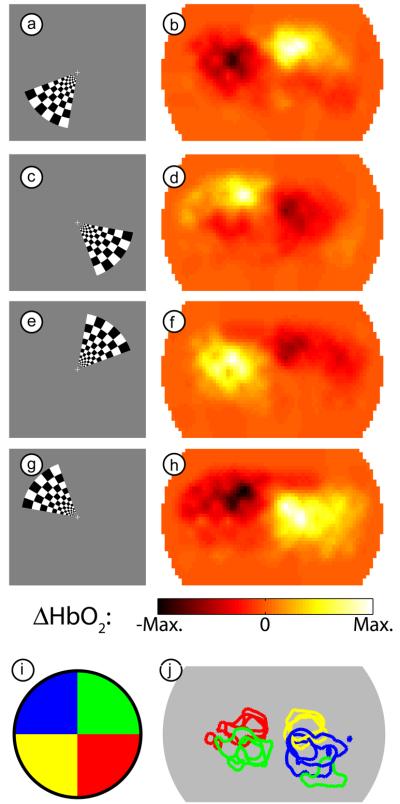
Figure 3. Examples of activations due to a counter-clockwise rotating wedge stimulus.
(a) One frame of the counter-phase flickering checkerboard in the lower left visual field. (b) An activation in subject 1 (session 1) due to this stimulus. In order to match the stimulus and response for this figure, we have used our measured 6 second lag between stimulation and maximal response. Note the maximum response is in the upper right visual cortex. (c-h) Three additional frames from the rotating stimulus (spaced evenly) and the resulting responses (from the same session). Note that the hemodynamic response is always maximal in the opposite visual quadrant from the stimulus. (i) Legend showing the color-coding of different visual quadrants, each corresponding to one of the stimuli (a,c,e,g) chosen from the full movie. (j) An overlay of contours drawn at half-maximum contrast for each of four stimuli (roughly corresponding to the visual quadrants in (i)) in subject 1 over three separate imaging sessions. Note the repeatability of the localization of the measurements. (In one session the upper-right visual field caused a second activation in the ipsilateral cortex, which may be due to worse signal-to-noise on that day.)

