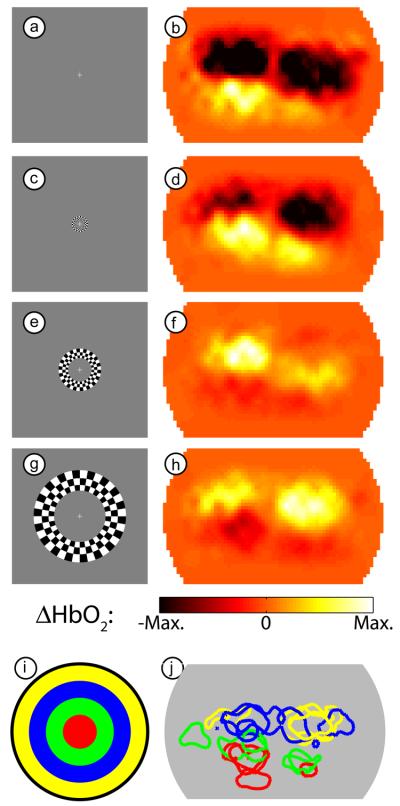
Figure 4. Examples of activations due to an expanding ring stimulus.
(a) One frame of the expanding ring checkerboard in the central visual field. (b) An activation in subject 4 (session 1) due to this stimulus. In order to match the stimulus and response for this figure, we have used our measured 6 second lag between stimulation and maximal response. Note the maximal response is bilateral and in the lower visual cortex. (c-h) Three additional frames from the expanding stimulus (spaced evenly) and the resulting response (from the same session). Note that the hemodynamic response moves upward as the stimulus moves outward. (i) Legend showing the color-coding of different visual eccentricities, each corresponding to one of the stimuli (a,c,e,g) chosen from the full movie. (j) An overlay of contours drawn at half-maximum contrast for each of four stimuli (roughly corresponding to the eccentricities in (i)) in subject 4 over three separate imaging sessions. Note the repeatability of the localization of the measurements.

