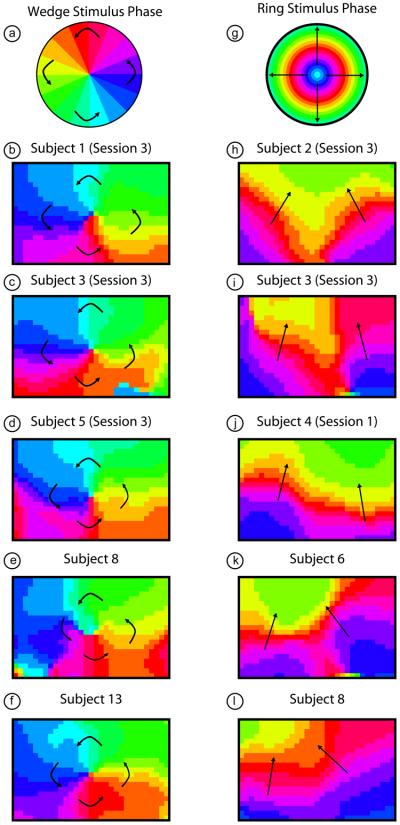
Figure 7. Retinotopic maps from phase-encoded stimuli in multiple subjects.
(a) A legend defining phases of visual angle within the visual field. (b-f) A retinotopic map of the organization of visual angle within the center of the visual cortex of four subjects. Note that in all subjects we see the same “pinwheel” pattern as in (a) and Fig. 3. Arrows are shown for orientation. (g) A legend defining phases of eccentricity within the visual field. (h-l) A retinotopic map of the organization of eccentricity within the center of the visual cortex of four subjects. Note that in all subjects we see the same stacked pattern as expected from the individual frame activation data (Fig. 4). Arrows are shown for orientation.

