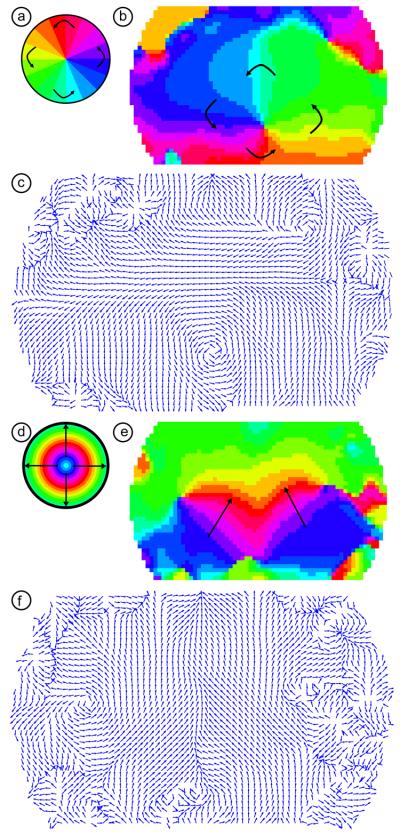
Figure 8. Retinotopic maps from phase-encoded stimuli in the subject-averaged data.
(a) A legend defining phases of visual angle within the visual field. (b) A retinotopic map of the organization of visual angle within the center of the visual cortex. Note the same “pinwheel” pattern as in (a) and Fig. 7 in the center of the field-of-view. (c) The gradient of the phase map in (b). Each arrow's length is normalized to one and the direction shows the direction of steepest ascent (after compensating for phase-wrapping). The arrows thus show the direction of motion of the traveling wave of activity due to the counter-clockwise wedge stimulus on the visual cortex. Note the large area of rotation. There is additional structure visible in the periphery of the field-of-view. (d) A legend defining phases of eccentricity within the visual field. (e) A retinotopic map of the organization of eccentricity within the center of the visual cortex. Note the same stacked pattern as expected from Figs. 4 and 7. (f) The gradient of the phase map in (e). Each arrow's length is normalized to one and the direction shows the direction of steepest ascent (after compensating for phase-wrapping). The arrows thus show the direction of motion of the traveling wave of activity due to the expanding ring stimulus on the visual cortex. Note the large area of bilateral upward gradients.

