
FIG. 2.
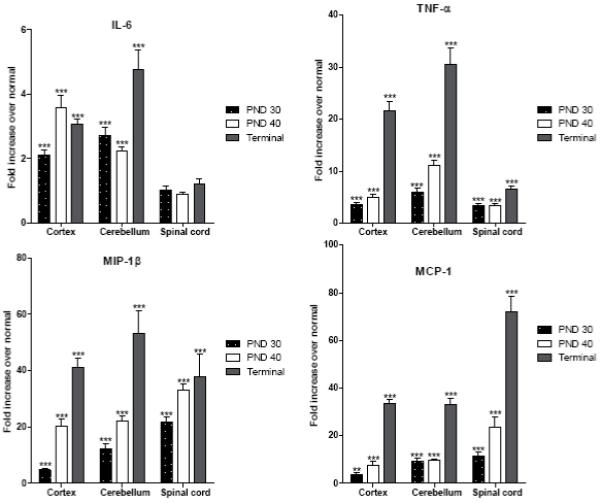
Expression of IL-6, TNF-α, MIP-1β and MCP-1 in the cortex, cerebellum and spinal cord of untreated affected trs mice at PND 30, PND 40 and terminal stage. Levels of mRNA specific for each factor were determined using real-time quantitative RT-PCR as described in Materials and Methods. Levels are presented as the mean ± SEM fold increase in five affected mice over normal mice. All values are corrected for total mRNA content using the housekeeping gene L13. Statistically significant differences in expression levels between normal mice and affected mice at a given time point were determined using the unpaired t test (*, P 0.01-0.05; **, P 0.001-0.01; ***, P < 0.001).