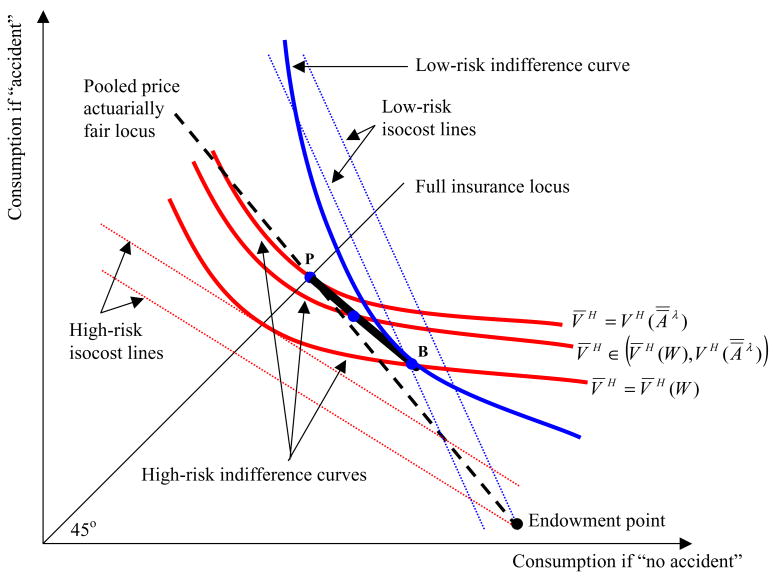
Fig. 1.
A stylized constrained Pareto frontier. The dark curve connecting B to P depicts the range of consumption bundles for low-risk (L) types achievable in the constrained Pareto optimal insurance market described in Eq. (1). More precisely, it depicts the consumption bundles for low-risk types consistent with: (i) high-risk (H) types receiving full insurance; (ii) a binding high-risk incentive compatibility constraint; (iii) firms breaking even in aggregate; (iv) high-risk types being no better off than at the pooled actuarially fair full insurance bundle (point P); (v) high-risk types being no worse off than with their full insurance actuarially fair insurance contract. It can be traced out by solving (1) for each minimum required level of high-risk type utility V̄H between V̄H (W) (the high-risk types’ utility with their full insurance actuarially fair bundle; point B) and (their utility with the pooled actuarially fair full insurance; point P).

