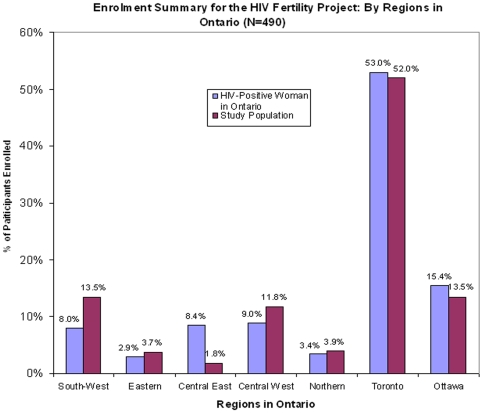
Figure 1. Comparison of regional distribution of study population to the regional distribution of Ontario HIV-positive female population from the 2006 epidemiologic data by provincial region laid out by the provincial Public Health [35].
Figure footnote: While target recruitment was 525, only 493 were recruited and only 490 met the inclusion criteria for analysis. Recruitment was halted due to futility of recruitment in one provincial region with low recruitment. The chi-square test p-values comparing the distribution of the sample and the total HIV-positive female population in Ontario according to geographic unit was <0.05 due to two over-enrolling regions and one under-enrolling region. However, the main reason for the regional representation of enrolment was to ensure that not all participants were from Toronto. When the chi-square test is carried out to assess Toronto vs. non-Toronto participants, the p-value is 0.6.

