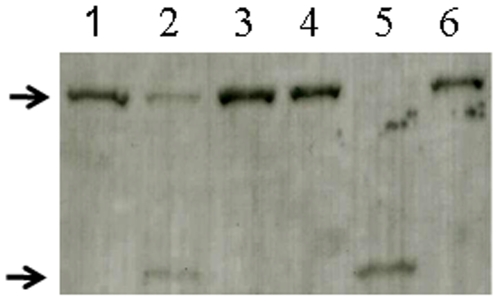
Figure 2. Degradation of human α-fodrin by SigA.
Purified GST-fodrin was incubated with SigA (lanes 1, 2 and 3) or Pet positive control (lanes 4, 5 and 6) for zero (lanes 1 and 4) or 6 h (lanes 2 and 5). Lanes 3 and 6 shows SigA or Pet, respectively, pre-treated with PMSF and incubated with GST-fodrin for 6 h. The top arrow indicates the 109 kDa GST-fodrin fusion protein and the 74 kDa subproduct of degradation is indicated by the bottom arrow.

