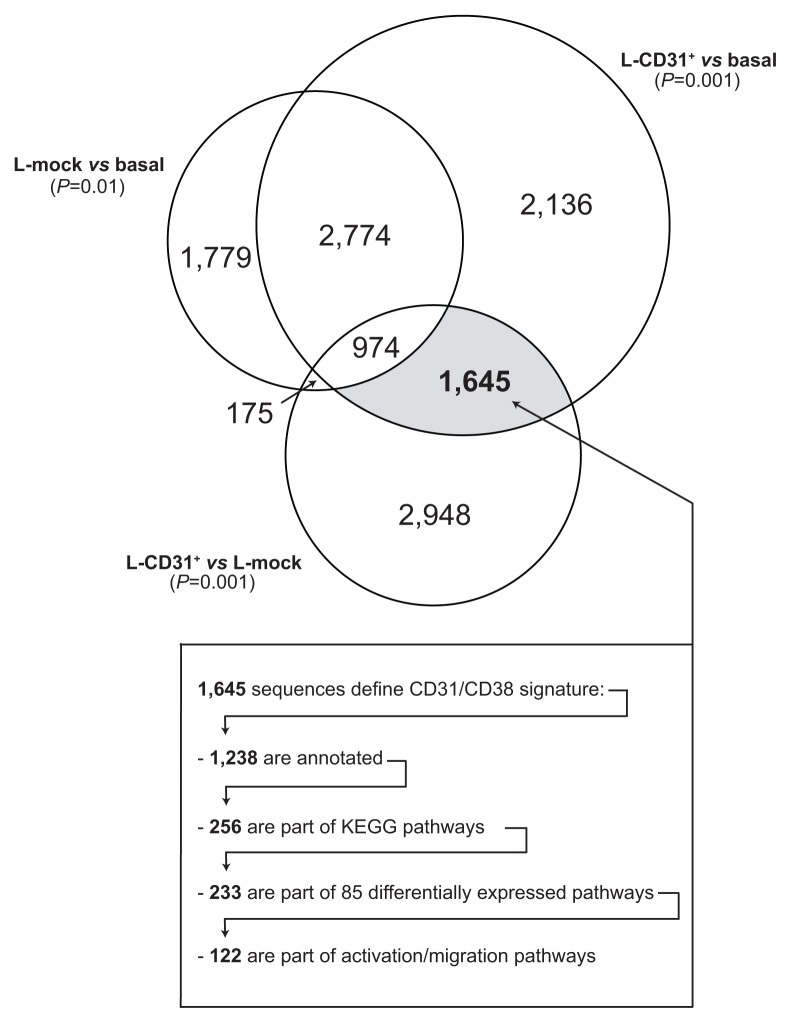
Figure 1. CD38 engagement by the CD31 ligand triggers genetic pathways leading to cell proliferation and movement.
Venn diagram showing the strategy selected to identify the signature in response to CD31/CD38 interactions. Results were obtained by applying error-weighted Student two-sample paired t-test with Benjamini and Hochberg p-value adjustment to “L-CD31+ vs L-mock”, “L-CD31+ vs basal” and “L-mock vs basal” class comparisons. Circle radii are proportional to the number of transcripts differentially expressed in each condition. The grey area defines the CD31/CD38 signature. A cut-off of 0.01 for the adjusted p-value was applied to exclude genes that changed expression simply as a result of co-culture (“L-mock vs basal”), while a more stringent threshold (adjusted P<0.001) was applied to the other two comparisons. The resulting 1,645 sequences are involved in 85 differentially regulated pathways identified by PLAGE. 30% of these pathways are implicated in lymphocyte adhesion/movement and/or signalling.

