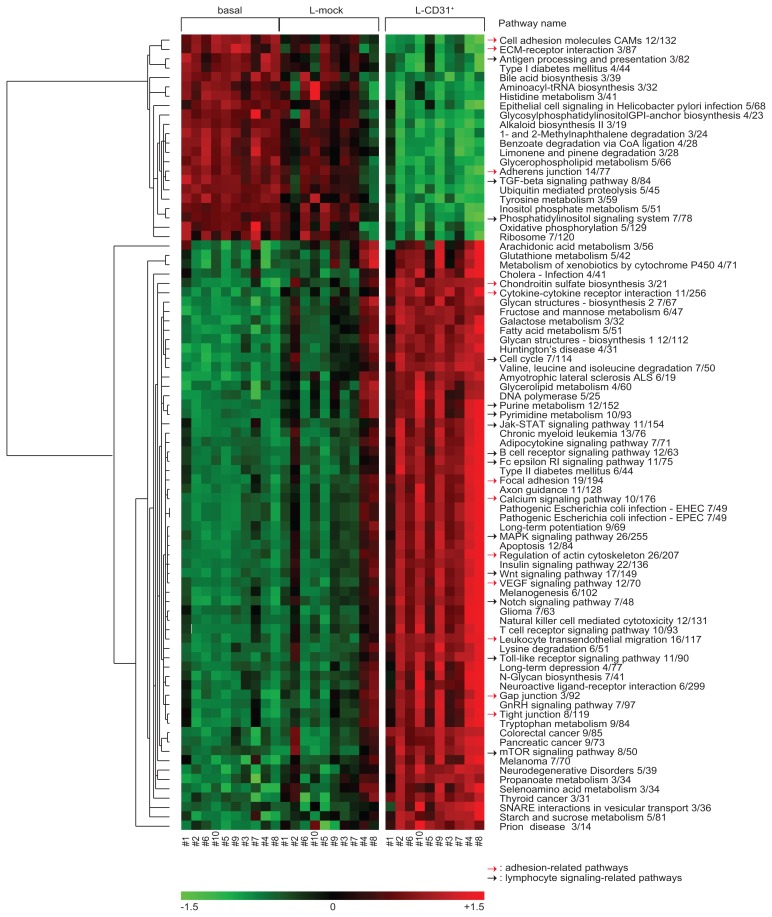
Figure 2. Representation of the expression pattern of 85 pathways differentially expressed as a consequence of CD31/CD38 interactions.
Hierarchical clustering was applied to the matrix of the activity levels of the 85 KEGG pathways found as differentially expressed in the L-CD31+ samples as compared to the basal and L-mock ones by PLAGE analysis.

