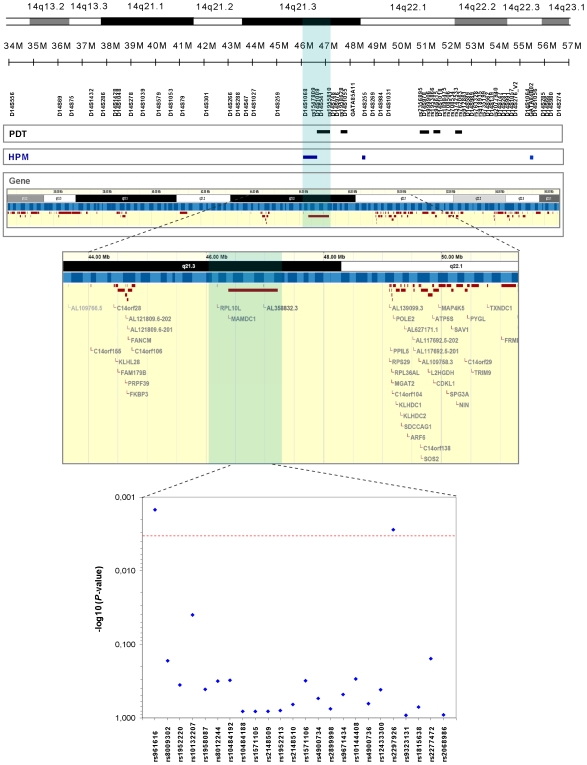
Figure 1. Identification of MAMDC1 as the SLE susceptibility locus in the 14q21-q23 linkage region.
Fine mapping towards the identification of MAMDC1 was first performed in the original Finnish family cohort by genotyping 19 MS markers and 17 SNPs, focusing on the two regions located on 14q11.2-q23 that showed haplotype sharing in the previous fine-mapping [16], [17]. PDT and HPM analyses were used and regions providing significant results (p≤0.05) are shown in black and blue, respectively (top of the figure). The region between markers D14S1068 and rs1955810, containing the gene MAMDC1, was selected for further fine mapping (highlighted in blue). Twenty-four SNPs were subsequently genotyped in the whole sample material and as shown graphically in the figure, significant association for the SNPs rs961616 and rs2297926 could be identified using a combined analysis (bottom of the figure). The significance threshold were set to P = 0.0032 (see the statistics section under material and methods) and is represented by a red line.

