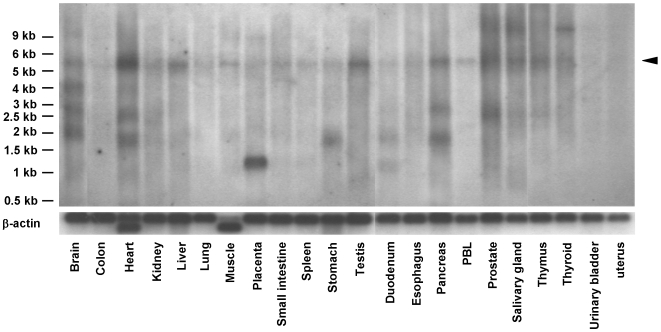
Figure 5. Analysis of MAMDC1 mRNA expression.
Northern blot analysis of MAMDC1 mRNA expression in different human tissues, showing several expressed splice variants. MAMDC1 mRNA transcript corresponding to the full-length isoform is indicated by an arrowhead on the right side. A β-Actin cDNA control probe was used for normalization (bottom).

