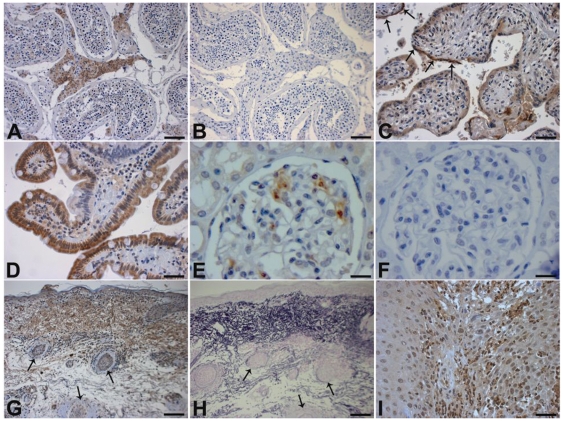
Figure 6. Analysis of MAMDC1 protein expression.
IHC analysis of MAMDC1 protein expression in A) testis, showing positive staining in Leydig cells; B) testis, negative control; C) placenta, showing positive staining in syncytial trophoblasts (arrows); D) positive duodenal villi; E) kidney, positive staining observed in occasional glomerular neutrophils; F) kidney, negative control; G) SLE skin with positive staining in the upper dermis in the same region as elastic fibres; H) SLE skin stained with Weigert's Resorcin-Fuchsin, detecting elastic fibers: arrows in G and H mark corresponding regions I) Cutaneous squamous cell cancer, with positive staining in neutrophils. Scale bars: 5 µm (A, B, G, H), 2.5 µm (C, D, I), 1.6 µm (E, F).

