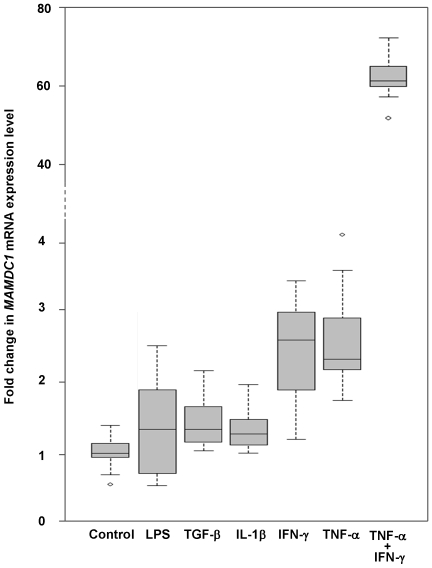
Figure 7. Effect of selected cytokines on MAMDC1 mRNA expression in THP-1 monocytes.
THP-1 cells were treated for 24 h with LPS, TGF-β1, IL-1β, IFN-γ, TNF-α, or a combination of TNF-α and IFN-γ, and MAMDC1 mRNA expression was quantified by Real-Time PCR in triplicate experiments. The results are reported as fold changes relative to THP-1 cells grown in the absence of stimulation (control), with the smallest observation, lower quartile, median, upper quartile, and largest observation shown for each sample.

