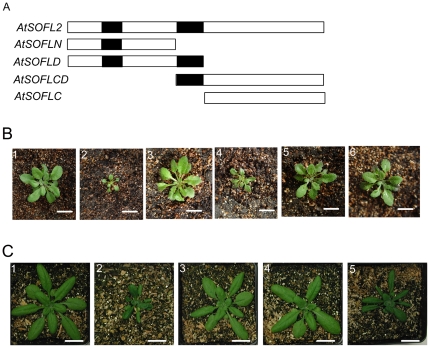
Figure 2. Phenotypes of transgenic plants overexpressing different domains of AtSOFL2 and the full-length AtSOFL2 gene with point mutations.
A. The schematic diagram of AtSOFL2 and the constructs used for overexpression experiment, including AtSOFLN, AtSOFLD, AtSOFLCD and AtSOFLC. Empty and solid rectangles represent protein-coding regions and the SOFL domains of AtSOFL2, respectively. B. The wild-type (B1), 35S:AtSOFL2 plants (B2) and transgenic plants overexpressing AtSOFLN (B3), AtSOFLD (B4), AtSOFLCD (B5) and AtSOFLC (B6) were grown for one month and a half in the green house. Scale bar = 1.5 cm. C. The wildtype (C1), 35S:AtSOFL2 plants (C2) and transgenic plants overexpressing AtSOFL2 gene with point mutations T21I (C3), D80N (C4) and D52N (C5) were grown for one month in the greenhouse. Scale bar = 1.5 cm.

