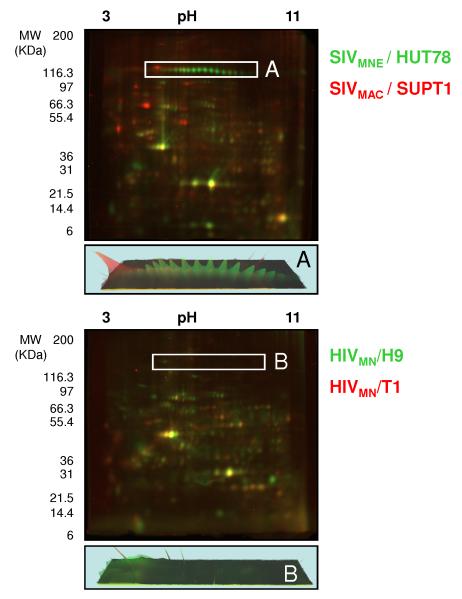
Figure 1. Comparison of SIV and HIV strains, illustrating the differences in viral and host protein composition.
Two-dimensional gel electrophoresis with fluorescent labeling of 50μg of capsid protein equivalents for each virus was used to compare SIVMNE /HUT78, Cy3-labeled (green), and SIVMAC / SUPT1, Cy5-labeled (red) (top panel) and HIVMN / H9, Cy3-labeled (green), and HIVMN / T1, Cy5-labeled (red) (bottom panel). The region containing gp120 in SIV and HIV is indicated as box 1 and 2 respectively, and the representative three-dimensional protein abundance plot is presented for each region below. Gels were visualized by fluorescent scanning.

