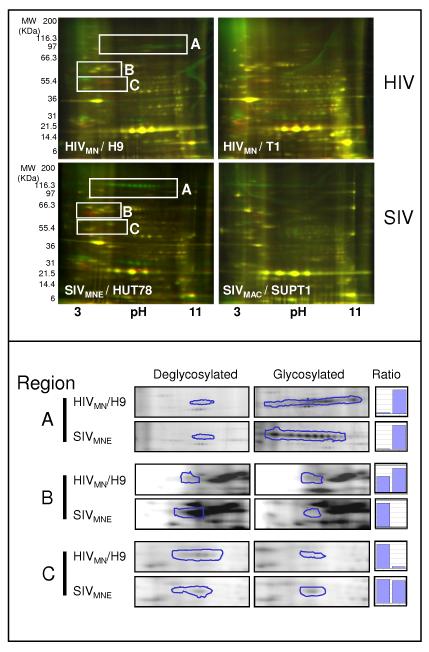
Figure 3. PNGase F treatment of HIV and SIV and assessment by fluorescent 2-dimensional gel electrophoresis.
Equal amounts of either HIV or SIV (strain indicated in white inlaid) were first treated with Peptide N-Glycosidase F (PNGase F) or with control buffers, labeled with either Cy3-control (green) or Cy5-PNGase F (red), and then subjected to two-dimensional electrophoresis (15 μg of each, for a total of 30μg per gel). Deglycosylation by PNGase F results in a decrease in molecular mass, and an acidic shift if the N-linked glycan is neutral (conversion of asparagines to aspartic acid). Gels were visualized by fluorescent scanning. In the bottom panel, regions identified as gp120 were analyzed by PROGENESIS software (see methods) and relative ratios of signal between glycosylated and deglycosylated gels were compared.

