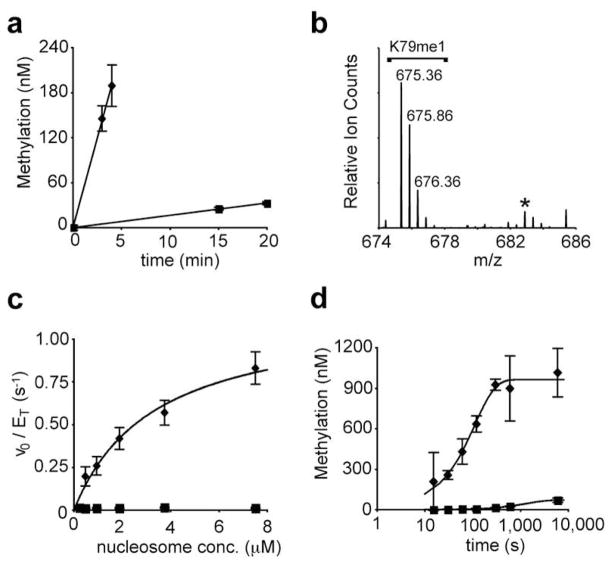
Figure 3. Kinetic analysis of Dot1L-mediated methylation of uH2BG76A nucleosomes.
a, Representative time course of Dot1Lcat-mediated methylation of 0.9 μM nucleosome bearing H2B (squares) or uH2BG76A (diamonds). Linear regression models of the data are shown. Error bars represent one s. d. (n = 2). b, LC-MS/MS chromatogram showing K79 monomethylation (K79me1) in the absence of dimethylation for uH2BG76A nucleosomes at 1.8 μM. [M+2H]2+ charge states are labelled. An asterisk marks a contaminant that is not dimethylated K79. c, Steady-state kinetic analysis of Dot1Lcat activity of nucleosomes bearing H2B (squares) or uH2BG76A (diamonds). Fit of uH2BG76A data to the Michaelis-Menten model is shown. Error bars represent one s. d. (n = 6). d, Kinetic analysis of methylation of nucleosomes bearing H2B (squares) or uH2BG76A (diamonds) by excess Dot1Lcat. X-axis is shown in log10 scale to emphasize early time points. Single exponential modelling of the data is shown. Error bars represent one s. d. (n = 3).

