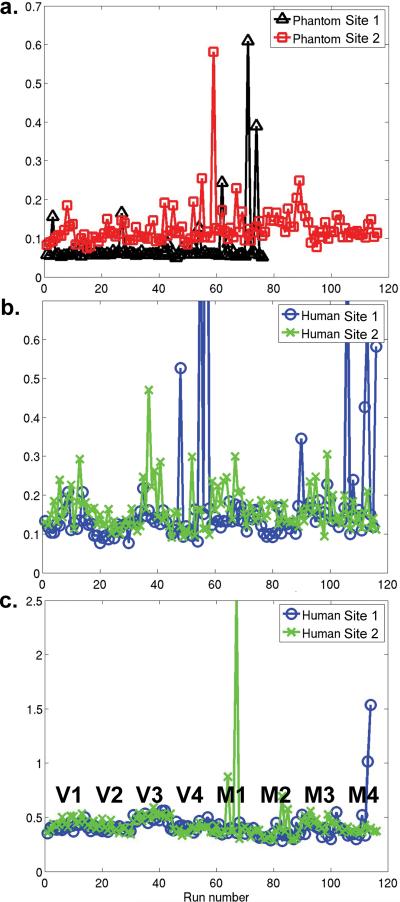
Figure 2.
Normalized root mean square error (or noise) as a percentage of the mean for a) phantom quality control runs, b) supraventricular white matter, and c) residual mean error in the motor and visual functional tasks. Note that V1 indicates subject 1, visual task and M2 indicates subject 2, motor task. Subject/task labels are valid for b) and c).

