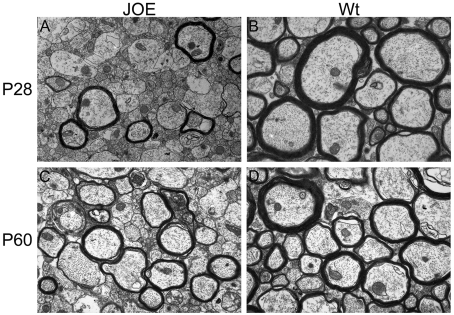
Figure 5. Severe hypomyelination is evident in the JOE CC.
Electron micrographs reveal extensive hypomyelination in the JOE CC at P28 (A and B). The number of myelinated axon profiles increased by P60 (C and D). At both ages, the JOE axons that were myelinated had significantly thinner myelin than that found in the WT CC. Magnification ×14000.

