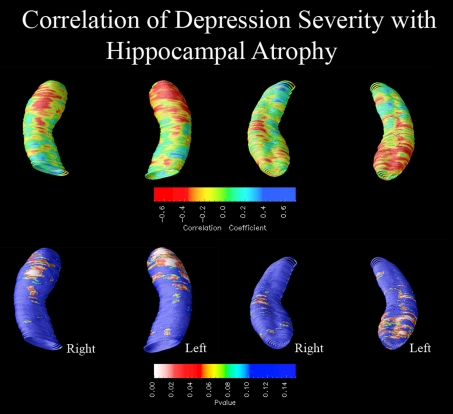
Figure 2. Correlation of hippocampal morphology with depression severity.
Three-dimensional statistical maps show significant relationships between age-adjusted HDRS score and regional hippocampal atrophy within the depressed group (left-hand depicts inferior view of the hippocampus, right-hand depicts superior view). In the significance maps (bottom panel), red and white colours denote P values ≤0.05. Greater depression severity was associated with greater left hippocampal atrophy, particularly in the subiculum and CA1 subfields (left, Pcorrected = 0.009; right, Pcorrected = 0.29).

