
Figure 6.
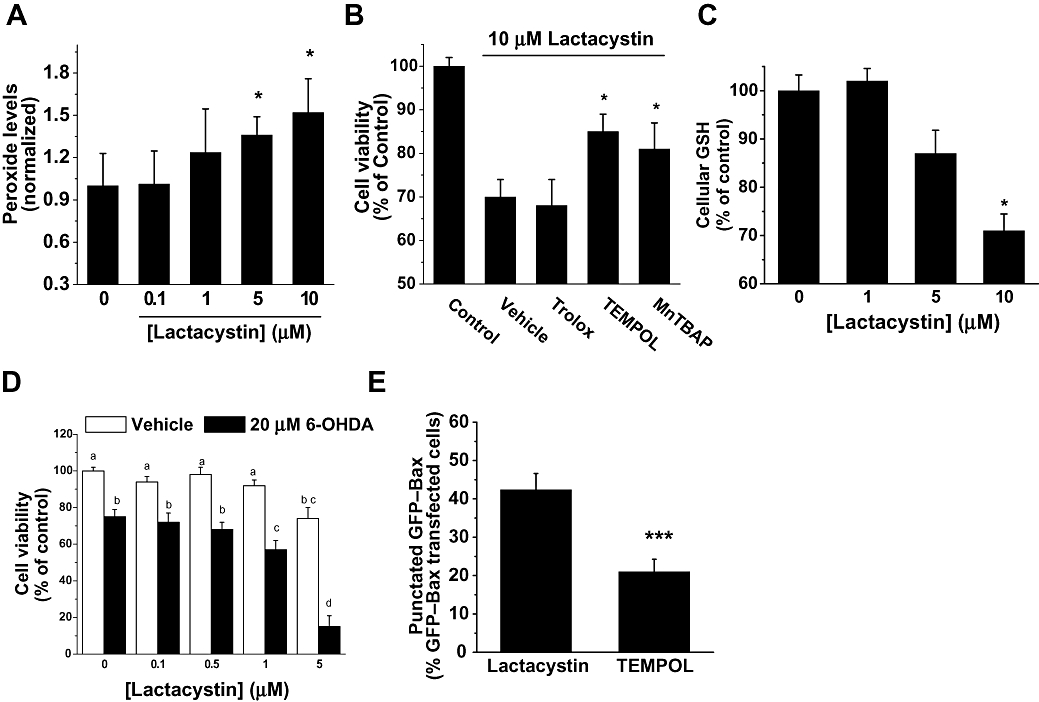
Effect of lactacystin on cellular redox state. (A) The production of reactive oxygen species was monitored 4 h after treatment of SH-SY5Y cells with lactacystin at different concentrations (0–10 µM), by fluorescence of dichlorofluorescein. Data were normalized to vehicle-treated (0 µM lactacystin) cells, and values were reported as the mean ± SD of five independent experiments performed in quadruplicate. *P < 0.05; versus control conditions (0 µM lactacystin). (B) Antioxidant drug effects on lactacystin-induced toxicity. Cell cultures were pretreated with either Trolox (0.75 mM), TEMPOL (0.2 µM) or MnTBAP (10 µM) for 30 min before the addition of 10 µM lactacystin. Cell viability was determined at 24 h by 3-(-4,5-dimethylthiazol-2-yl)-2,5-diphenyltetrazolium bromide (MTT) assay. Data are expressed as the mean ± SD of at least four different cultures. Student's two-tailed, unpaired t-test. *P < 0.05. (C) Levels of glutathione in SH-SY5Y cell cultures were determined 12 h after lactacystin treatment. The values are expressed as a percentage of monochlorobimane fluorescence from untreated conditions. Data are expressed as the mean ± SD of four different cultures, performed in quadruplicate. Student's two-tailed, unpaired t-test. *P < 0.05. (D) Lactacystin potentiated 6-hydroxydopamine (6-OHDA)-induced cell death. Cell cultures were co-treated with lactacystin (0–5 µM) and 20 µM 6-OHDA. Cell viability was determined by MTT assays 24 h later. Data are expressed as the mean ± SD of at least four different cultures. Treatments with the same lowercase letters are not significantly different (one-way analysis of variance; Tukey's test, P > 0.05). (E) SH-SY5Y cells were transfected with green fluorescent protein (GFP)–Bax and were incubated for 24 h to allow sufficient GFP–Bax expression. Cells were pretreated with TEMPOL (0.2 µM) for 30 min, prior to the addition of lactacystin (10 µM) for an additional 12 h. The number of cells with punctate Bax distribution was expressed as a percentage of the total number of cells expressing GFP–Bax protein. Data are expressed as the mean ± SD of at least four different cultures. Student's two-tailed, unpaired t-test. *P < 0.05.