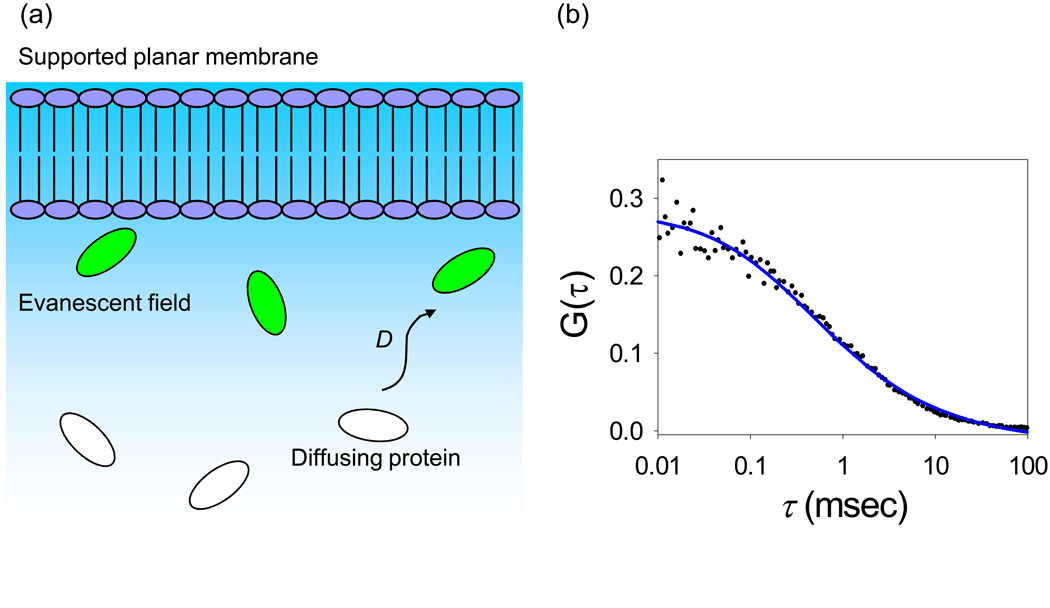
Figure 3. Diffusion Through the Evanescent Wave.
(a) Schematic of diffusion close to a supported planar membrane. Fluorophores in the path of the evanescent wave are excited, and fluoresce. (b) Representative TIR-FCS data of diffusion, fit to an appropriate theoretical autocorrelation function. The data pertain to 10 nM Alexa448-labeled IgG in PBS with 1 mg mL−1 unlabeled IgG and 10 mg mL−1 ovalbumin diffusing close to a supported planar membrane. Reproduced with permission from Biophys. J. 2003. 85, 3294–3302.

