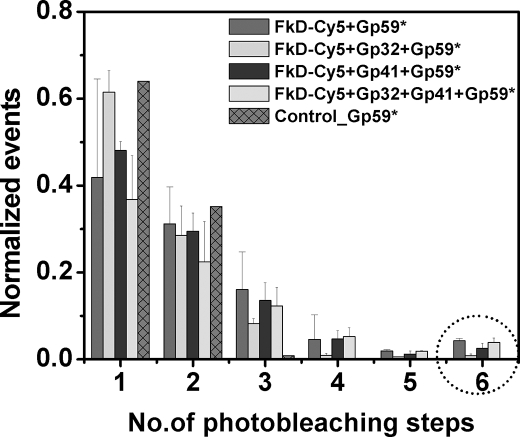
FIGURE 3.
Histogram plot of smPB events. The histogram represents the smPB experiment done with Cy5-labeled forked DNA (FkD-Cy5) with gp59-Alexa 555 and other proteins. Histograms show the normalized events versus number of photobleaching steps. Similar histograms were built for smPB experiments with unlabeled forked DNA with the same proteins (data not shown). The experiments were done in triplicate, and the errors assigned. The population of the hexamer seen is indicated by the circle.

