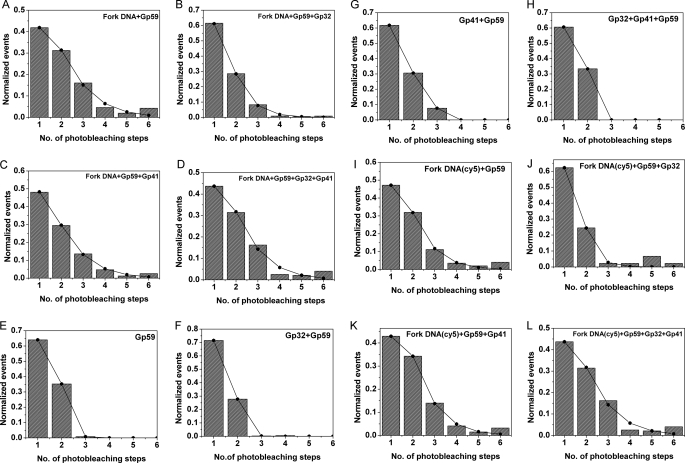
FIGURE 4.
Plots of smPB experiments. The following plots show the experimental and fitted data for various smPB experiments. The data were fitted to a monomer model using Equation 4 as described under “Materials and Methods.” The normalized number of events and their corresponding photobleaching steps were provided as the input, whereas [A], K, and σ were used as fitting parameters. A–D, unlabeled forked DNA + gp59 and other proteins (i.e. gp32 and gp41); E–H, gp59 and other proteins alone; I–L, Cy5-labeled forked DNA and gp59 and other proteins.

