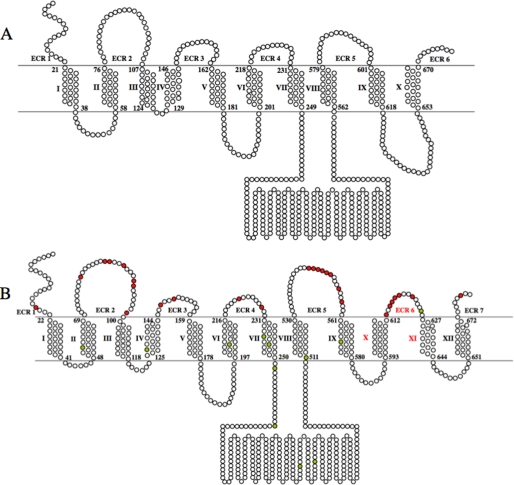
FIGURE 8.
A, previously proposed structure for SLC20A1 (PiT1). Residues are represented as circles. The lipid bilayer is represented as the region within the double line; residues above the line are extracellular, and residues below the line are intracellular. The extracellular regions are numbered 1–6. The first and last residues of each TMH are numbered; TMHs are numbered with roman numerals. B, comprehensive topological model for SLC20A1 (PiT1) using information experimentally derived by SCAM to set constraints for an HMMTOP-based prediction. Residues that are B-mal-accessible on the outside of the cell are shown as red circles. Green circles represent native cysteine residues inaccessible to B-mal. The extracellular regions are numbered 1–7 with the novel ECR 6 and TMHs X and XI shown in red.

