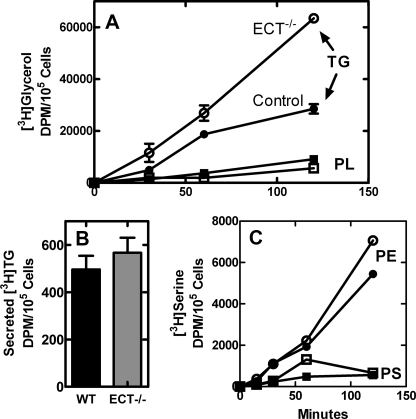
FIGURE 10.
Rates of lipid synthesis in control and ECT-deficient hepatocytes. A, metabolic labeling of ECT-deficient and control hepatocytes with [3H]glycerol. The amounts of glycerol incorporated into the TG and phospholipid (PL) fractions were determined following extraction and thin layer chromatography as described under “Experimental Procedures.” ●, control TG; ○, ECT-deficient TG; ■, control phospholipid (PL); □, ECT-deficient phospholipid. The data are representative of two independent experiments. B, [3H]TG secretion. The amount of [3H]glycerol-labeled TG recovered in the medium from control and ECT-deficient hepatocytes after 2 h. WT, wild type. C, metabolic labeling of control and ECT-deficient hepatocytes with [3H]serine. ●, control PtdEtn; ○, ECT-deficient PtdEtn; ■, control PtdSer; □, ECT-deficient PtdSer.

