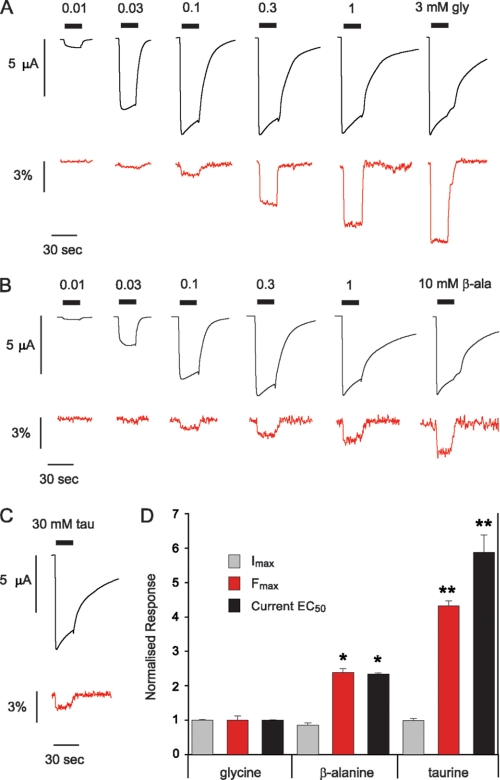
FIGURE 3.
Different agonists induce distinct conformations in loop 2 in the inner β-sheet. A–C, current (black) and fluorescence (red) traces recorded from oocytes injected with A52C during application of glycine (A), β-alanine (B), and taurine (C) (traces in A modified from Ref. 27). D, comparison of agonist-induced maximal current (ΔImax, gray), maximal fluorescence (ΔFmax, red), and current EC50 (black). Note that the Fmax values have been inverted to facilitate comparison. Data normalized to mean values obtained for glycine (27). Single asterisks indicate significant difference to glycine values (*, p < 0.0005, Student's t test). Double asterisks indicates significant difference to both glycine and β-alanine values (**, p < 0.0005, Student's t test).

