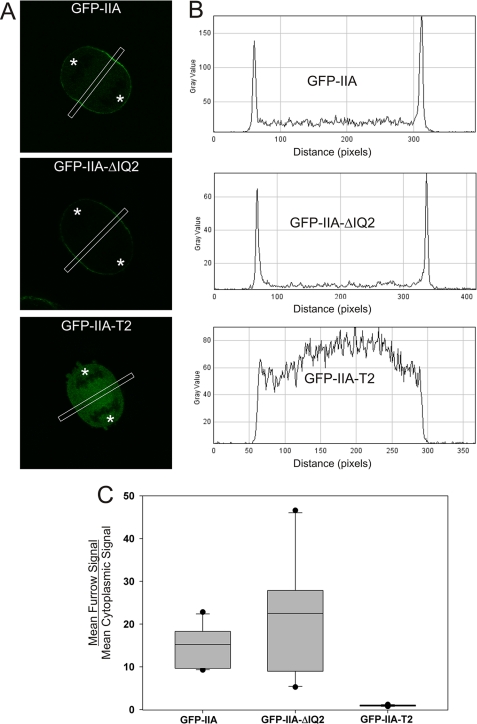
FIGURE 2.
GFP-IIA-ΔIQ2 localizes to furrow efficiently in HeLa cells. A, HeLa cells were transfected with the indicated plasmid. Z-stacks of early anaphase cells were collected. The middle slice, defined as the slice with the largest pole-to-pole distance, was used for analysis. A 15-pixel-wide line was drawn through the equatorial region (shown as white boxes in panel A). B, the line scans were converted to plot profiles. C, for each furrow analyzed, the mean furrow signal and mean cytoplasmic signal were calculated. The box plot shows the ratio of furrow signal to cytoplasmic signal for 12 furrows per construct. The ends of the boxes define the 25th and 75th percentile, with a line at the median and error bars defining the 10th and 90th percentiles. Dark circles indicate the maximum and minimum. In panel A, asterisks indicate the approximate position of spindle poles.

