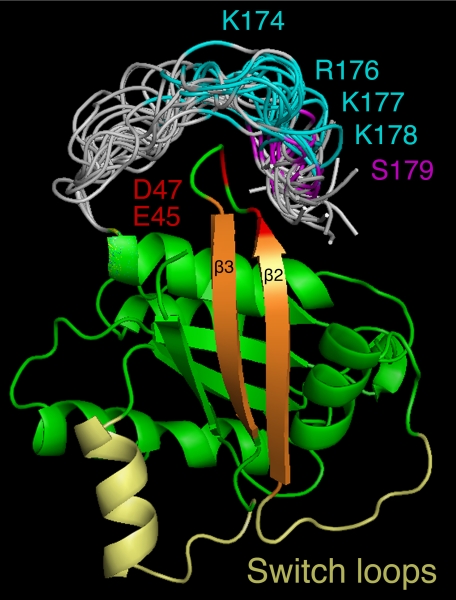
FIGURE 7.
Proposed model for phosphorylation-induced allostery. Modeled C-terminal conformations (gray) as an extension of the known Rap1a structure (green) highlight the polybasic region (cyan) and the position of the Ser179 phosphorylation site (magenta). Putative electrostatic interactions between the polybasic region and the acidic residues Glu45 and Asp47 (red) and the role of the β2-β3 strands (orange) communicating to the switch loops (yellow) are shown. The figure was generated using PyMOL (38).

