FIGURE 3.
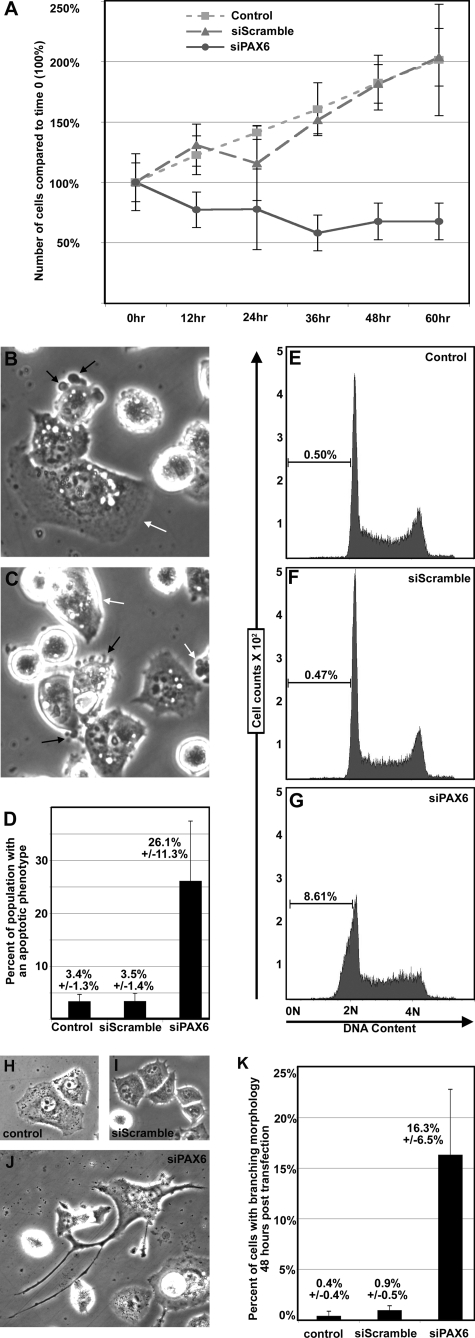
Inhibition of PAX6 expression leads to a reduction of cell numbers, apoptosis, and a change in cellular morphology. A, cell numbers over a 60-h time course. PANC-1 cells that are untransfected (squares) or transfected with a random siRNA (siScramble; triangles) or with PAX6 gene-specific siRNA (siPAX6; circles) are counted at 12-h intervals to 60 h (x axis). Cells are counted at the time of transfection, and this number is set at 100% of starting levels. Cell numbers are presented as percentage of 0 h levels (y axis). B and C, morphology of siPAX6-transfected cells 9 h post-transfection. A number of the cells display blebbing (black arrows), rounding up, and a loss of adhesion to the culture plate. There are also cells that maintain the parental phenotype (white arrows) (magnification, ×400). D, quantification of cells shown in B and C with an apoptotic morphology. In six random fields, total cells and cells with overt signs of apoptosis (blebbing, rounding up) are counted and graphed. The average percentage of the population with an apoptotic phenotype for untransfected, siScramble-transfected, and siPAX6-transfected PANC-1 cells is 3.4 ± 1.3%, 3.5 ± 1.4%, and 26.1 ± 11.3%, respectively. E–G, measurement of DNA content by flow cytometry. DNA from PANC-1 cells that are untreated or are 9 h post-transfected with siScramble or siPAX6 is stained with propidium iodide. DNA from cells in G0/G1 is measured as 2 n, and G2 DNA is measured as 4 n. DNA fragmented during apoptosis is seen as a population less than 2 n. This population is 0.5, 0.47, and 8.61% of the total cell counts for the untransfected, siScramble-transfected, and siPAX6-transfected PANC-1 cells, respectively. H, phenotype of the untransfected cells at the 24 h time point. I, phenotype of the siScramble-transfected cells at the 24 h time point. J, phenotype of the siPAX6-transfected cells at the 24 h time point. Although the majority of cells in the control groups have an epithelioid phenotype, the siPAX6-transfected cells have several branchlike outgrowths (H, I, and J; magnification, ×200). K, quantification of cells shown in H–J with a branching morphology. In six random fields, total cells and cells with overt signs of branching are counted and graphed. The average percentage of the population with a branching phenotype for untransfected, siScramble-transfected, and siPAX6-transfected PANC-1 cells is 0.4 ± 0.4, 0.9 ± 0.5, and 16.3 ± 6.5%, respectively.

