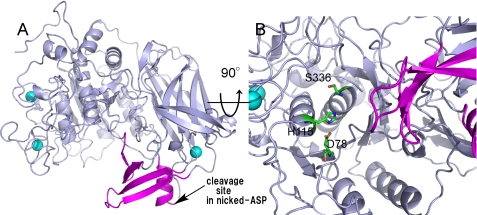
FIGURE 3.
Structure of extra occluding region of ASP. A, the extra occluding region consisting of L2, pL1, and pL2 is shown in purple. Other regions and Ca2+ ions are shown in gray and greenish cyan, respectively. The cleavage site between residues 519 and 520 of nicked ASP is indicated by the arrow. B, a close-up view of the catalytic site is shown. The color scheme is the same as in A, except for the catalytic triad (green).

