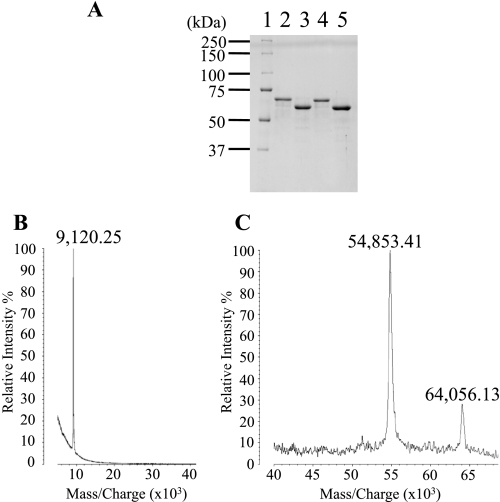
FIGURE 5.
Analysis of nicked ASP using mass spectrometry. A, SDS-PAGE (10% polyacrylamide gel) of the purified samples from fractions X (lane 2) and Y (lane 3) in Fig. 4B. Similarly, we also obtained the purified samples from two fractions corresponding to X (lane 4) and Y (lane 5) using the mutant strain producing ASP(H115A). Numbers along the side indicate molecular masses in kDa. Lane 1, molecular mass standards. B and C, a sample of lane 3 in A was analyzed by a matrix-assisted laser desorption ionization type mass spectrometer following the method described in the text. The mass values of each peak are shown on the figure.

