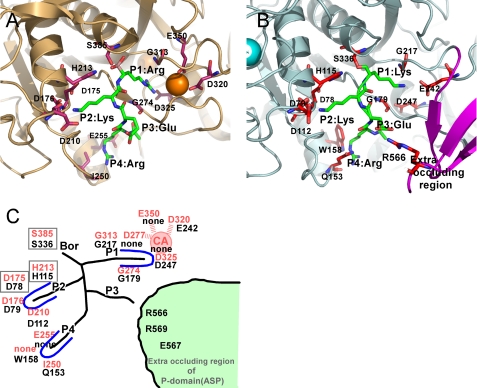
FIGURE 7.
Structural comparison of the subsites in ASP and Kex2. A, close-up view of catalytic site of S. cerevisiae Kex2 with a bound inhibitor (Protein Data Bank code 1R64), which is shown in light orange. One Ca2+ ion bound to Kex2 is shown as orange spheres. The important residues making up the subsites are shown as orange sticks. B, close-up view of the catalytic site of ASP with a bound substrate model (Lys-Lys-Glu). The important residues that make up the subsites are shown as red sticks. The Ca2+ ion bound to ASP is shown as greenish cyan spheres. The extra occluding region is shown in purple. C, schematic representation of the subsites of Kex2 and ASP. The site of Kex2 and ASP are labeled in red and black letters.

