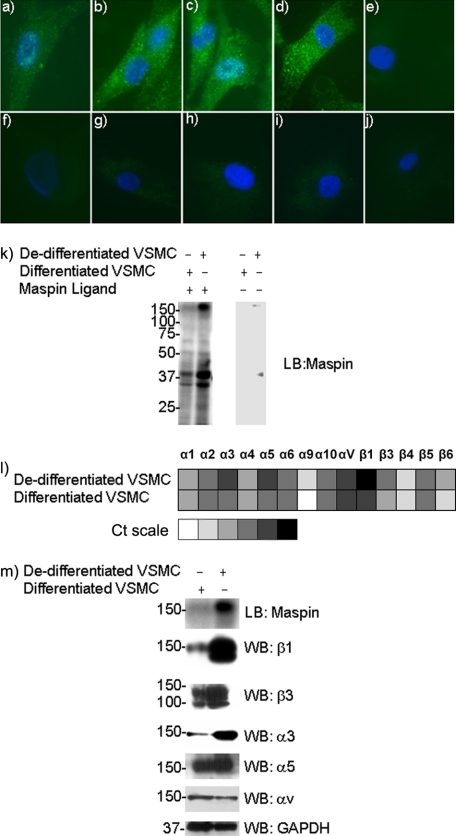
FIGURE 1.
Maspin binding to VSMC. Panels a–j, maspin binding to VSMC detected by immunofluorescence microscopy. Purified recombinant maspin (0 nm) (panels a and f), 40 nm (panels b and g), 80 nm (panels c and h), and 250 nm (panels d and i) was incubated with either de-differentiated (panels a–e) or differentiated (panels f–j) VSMC. Isotype-matched IgG (2 μg/ml) controls are shown for cells incubated with 250 nm maspin (panels e and j). Anti-maspin (2 μg/ml) was used for detection. Secondary antibodies were Alexa Fluor 488-labeled (green), and nuclei were counterstained with DAPI (blue). k, ligand blot analysis of maspin binding to VSMC proteins. Whole cell lysates of both differentiated and de-differentiated VSMC were blotted onto PVDF membranes, incubated with recombinant maspin and probed with an anti-maspin antibody. Control blots in the absence of maspin incubation are also shown. l, quantitative real-time PCR (TaqMan) analysis of integrin gene expression in VSMC. Relative expression levels are shown as a “heatmap” based on Ct values, ranging from undetectable expression (40 cycles), through very low (35–39 cycles), low (30–34 cycles), moderate (25–29 cycles), high (20–24 cycles) to very high expression (<20 cycles). m, Western blot analysis of integrin expression in VSMC. Whole cell lysates of both differentiated and de-differentiated VSMC were blotted onto PVDF membranes and probed with anti-integrin antibodies. Ligand blot for maspin binding is shown for comparison, and GAPDH is used as a loading control (10 μg of cellular protein per lane).

