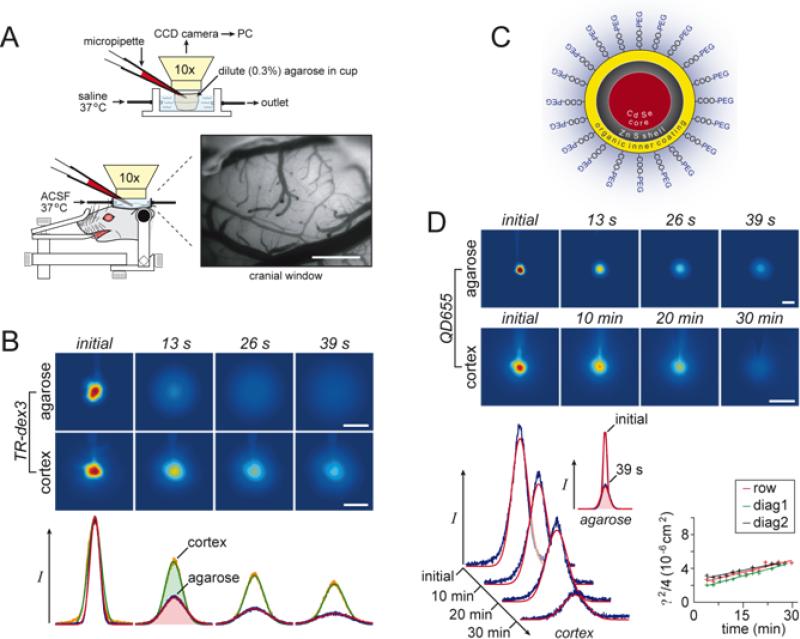
Fig. 6.
IOI measurements in vivo using 3 kDa dextran and quantum dots. A. Experimental setup for IOI diffusion measurements in vivo. Successive images of fluorescent probe diffusion were captured by a cooled charge-coupled device (CCD) camera and epifluorescent microscope with a 10× water-immersion objective (cf. Fig. 5A) after pressure ejection from a micropipette into either dilute agarose or somatosensory cortex, accessed through an open cranial window in rat (scale bar – 500 μm). B. Dextran diffusion in neocortex. Representative images after fluorescent dex3 ejection into agarose or cortex. Fluorescence intensity profiles and theoretical fits for the images shown below images, yielding D = 2.3 × 10⁻⁶ cm2 s−1 and D* = 4.5 × 10⁻⁷ cm2 s−1. Scale bars – 200 μm. C. Schematic of quantum dot (QD655, Invitrogen). Inner core cadmium and selenium provides characteristic fluorescence. The core is stabilized with a zinc shell which in turn has an organic coating to which are attached numerous PEG molecules to render the quantum dot water soluble. The final diameter of QD655 is 35 nm. D. Quantum dot diffusion in neocortex. Representative images after QD655 ejection into agarose or cortex. Scale bars – 100 μm. Fluorescence intensity profiles and theoretical fits shown below the images, yielding D = 1.9 × 10⁻⁷ cm2s−1 and D* = 1.6 × 10⁻⁹ cm2s−1. Linear regression of cortex data in inset (see Equation 20); , so regression of upon ti returns a slope of D*. (Panels A, B and D modified from Ref. 391).

