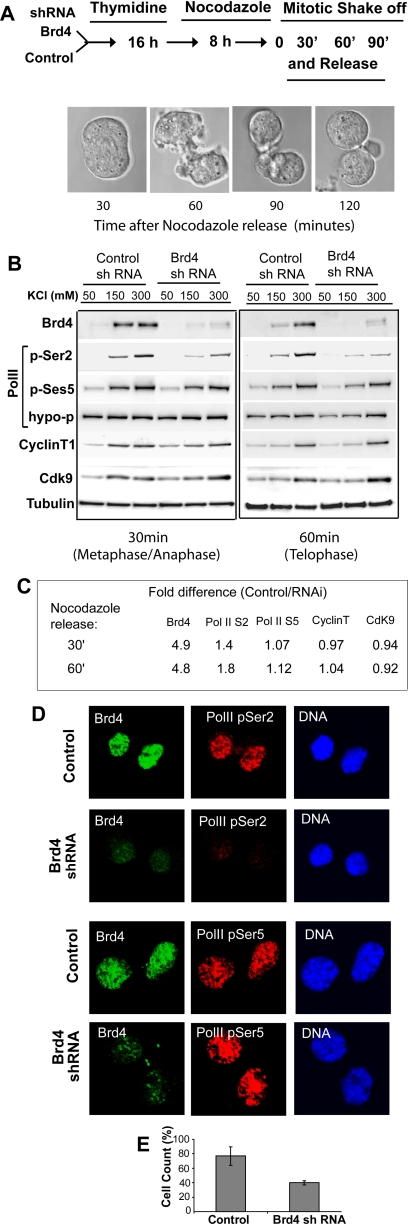
Figure 3.
Reduction of postmitotic S2-phosphorylation of Pol II CTD in Brd4 knockdown cells. (A) A diagram of the synchronization procedure. Cells with control shRNA or Brd4 shRNA were synchronized by thymidine and nocodazole, released, and allowed to proceed for the indicated times. Mitotic progression was viewed by DIC images. (B) Extracts from control (control shRNA) and Brd4 knockdown cells (Brd4 shRNA) at 30 and 60 min after release were extracted with buffers with increasing KCl concentrations. Extracts were immunoblotted with the indicated antibodies. Pol II phosphorylated at S2, or at S5 in the CTD, and hypophosphorylated Pol II were detected by H5, H14, and 8WG16 antibodies, respectively. (C) Quantification of immunoblot data. Band intensity of each protein was normalized by respective tubulin bands. Values represent the ratio of band intensity in control cells/Brd4 knockdown cells collected from all salt concentrations. Note that ratios are higher only for Brd4 and S2-phosphorylated Pol II. Similar results were seen with separate preparations of extracts. (D) Control and Brd4 knockdown cells at 90 min were coimmunostained for Brd4 (green) and Pol II with phospho-S2 CTD (top panels, red) or with phospho-S5 (bottom panels) and counterstained for DNA. (E) The percentage of phospho-S2 positive cells in control and Brd4 knockdown cells was obtained by counting 200–250 cells in three independent fields.

