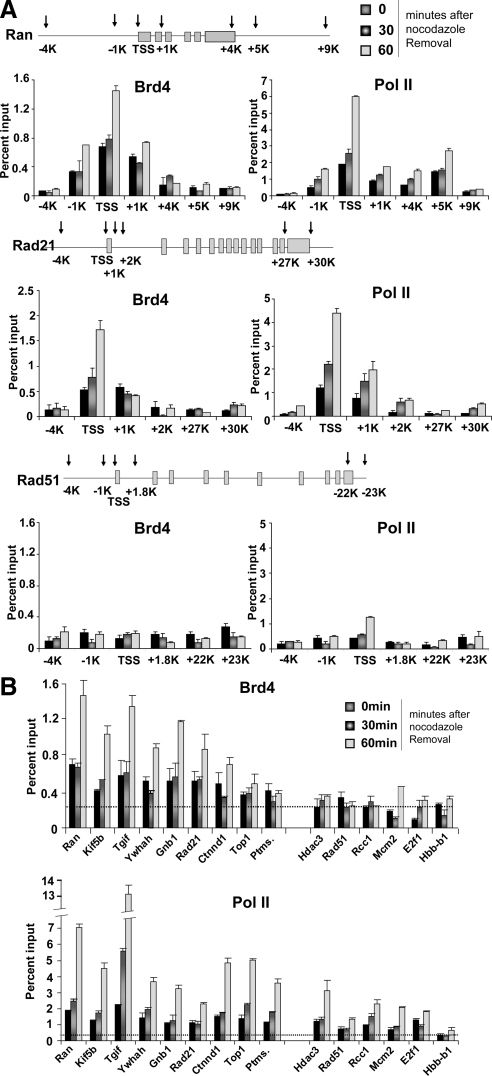
Figure 5.
Brd4 marks the TSS regions of M/G1 genes throughout mitosis. (A) ChIP analysis was performed with affinity-purified anti-Brd4 antibody (left) or antibody against hypophosphorylated Pol II (8WG16, right) at indicated sites in the Ran, Rad21, and Rad51 genes for cells at indicated times after release. Values in A and B (and all ChIP data below) represent the average of three determinations ± SD. (B) ChIP analysis was performed with the antibodies against Brd4 or hypophosphorylated Pol II as in A for the TSS regions of indicated M/G1 genes. Dotted lines represent averaged values for normal IgG binding (SD, <0.01%).

