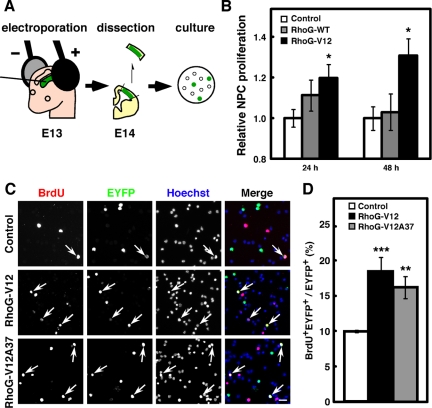
Figure 2.
RhoG-V12 promotes proliferation of cultured NPCs. (A) Schematic drawing of the experimental procedure for primary culture after in vivo electroporation. (B) Twenty-four hours after control, RhoG-WT, or RhoG-V12 vector was electroporated at E13, the regions of cortices containing EYFP+ cells were dissociated and dispersed on poly-d-lysine (PDL)-coated coverslips. Cells were fixed 3, 24, or 48 h after plating. Transfection efficiency was determined at 3 h after plating, and relative NPC proliferation was calculated by the percentages of EYFP+ cells in total cells normalized for transfection efficiency and expressed relative to the value from Control-electroporated cells at the indicated time, which was set at 1.0. Control, n = 6; RhoG-WT, n = 5; RhoG-V12, n = 4. Values indicate means ± SEM; *p < 0.05 versus control (Student's t test). (C) Control, RhoG-V12, or RhoG-V12A37 vector was electroporated at E13 and labeled with BrdU for 30 min at E14. The regions of cortices containing EYFP+ cells were dissociated and dispersed on PDL-coated coverslips. Cells were fixed 3 h after plating. Then cells were stained with anti-BrdU (red) and anti-GFP (green) antibodies. Nuclei were stained with Hoechst 33258 (blue). Arrows indicate BrdU+EYFP+ cells. Scale bar, 50 μm. (D) The numbers of BrdU+EYFP+ and EYFP+ cells were counted, and the percentages of BrdU+ cells in the total number of EYFP+ cells were calculated. Control, n = 6; RhoG-V12, n = 6; RhoG-V12A37, n = 6. Values indicate means ± SEM; **p < 0.01, ***p < 0.001 versus control (Student's t test).

