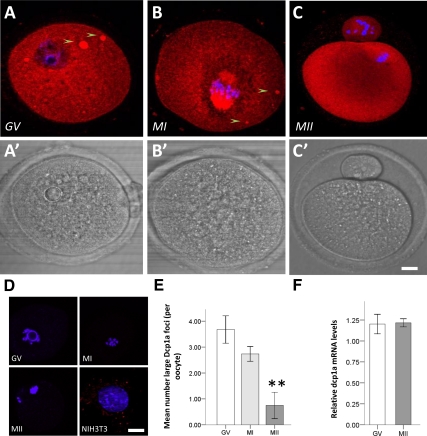
Figure 3.
Endogenous Dcp1a expression during oocyte meiotic maturation. Confocal fluorescence images showing the localization of Dcp1a protein as analyzed by immunocytochemistry in a representative: (A) GV oocyte; Dcp1a is diffused in the cytoplasm and in large foci (5–10 μm), see arrows. (B) MI oocyte; staining for Dcp1a is cytoplasmic as well as strongly present on the chromosome spindle, and large Dcp1a foci are still present. (C) MII oocyte; staining for Dcp1a is present in the cytoplasm, but large Dcp1a foci are absent. (A′–C′) Bright-field images for A–C images, respectively. (D) Positive and negative controls: GV, MI, and MII oocytes showing the absence of signal when the primary antibody is omitted; a mouse NIH3T3 cell line immunostained for Dcp1a showing distinct P-body-like foci. (E) Graph showing the mean number of large Dcp1a foci in GV (n = 38), MI (n = 38), and MII (n = 22); the reduction in MI is not significant (p = 0.098) but is significant in MII (p = 2 × 10⁻³). (F) Graph showing the relative level of dcp1a mRNA in GV and MII oocytes as analyzed by real-time PCR and normalized against GAPDH and β-actin; no significant difference was observed (p = 0.92). Scale bars, (A–G) 20 μm.

