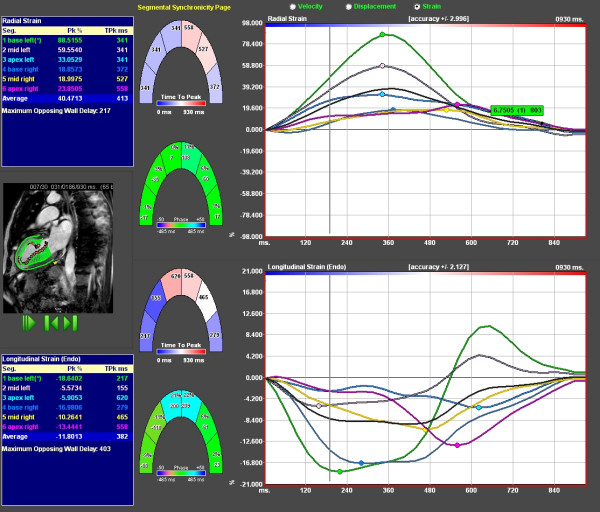
Figure 3.
Measurement window of feature tracking software. Middle figures show graphical display of 6 segments, three anterior and three inferoposterior. Right upper panel shows radial strain tracings from the six segments. Lower right panel depicts the corresponding longitudinal strain values. Velocity and displacement can be selected for alternative presentation. Left blue box shows peak values and time to peak for corresponding segments.

