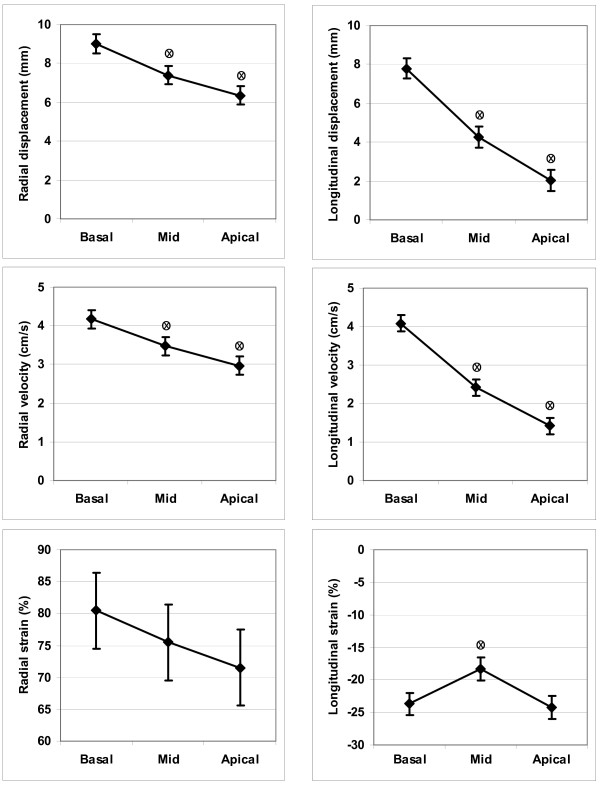
Figure 4.
Functional measures vs. location, non-scar patients. Left sided panels show radial displacement (upper), velocity (mid) and strain (lower), from three different segment levels, apex-mid-base. Right sided panels show the corresponding longitudinal values. o = denotes statistically significant difference (p < 0.05) compared to basal x = denotes statistically significant difference (p < 0.05) compared to nearest left value

